
One fleet
Inspects, maps and explains what it found.
For the assets that can't fail.
Capturing the data that keeps oil and gas, mining, construction, energy, infrastructure and farming running.
Our autonomous fleet inspects and maps the assets your teams are responsible for, from well pads and solar farms to quarries, building sites and fields. The Dronavid dashboard then turns every flight into measurements, findings and reports.
- 40 km
- [ Operating radius ]
- 2–5 cm
- [ Survey accuracy ]
- 1–3%
- [ Stockpile volume error ]
Platform
Every flight becomes measurements, findings and a report your whole team can read.
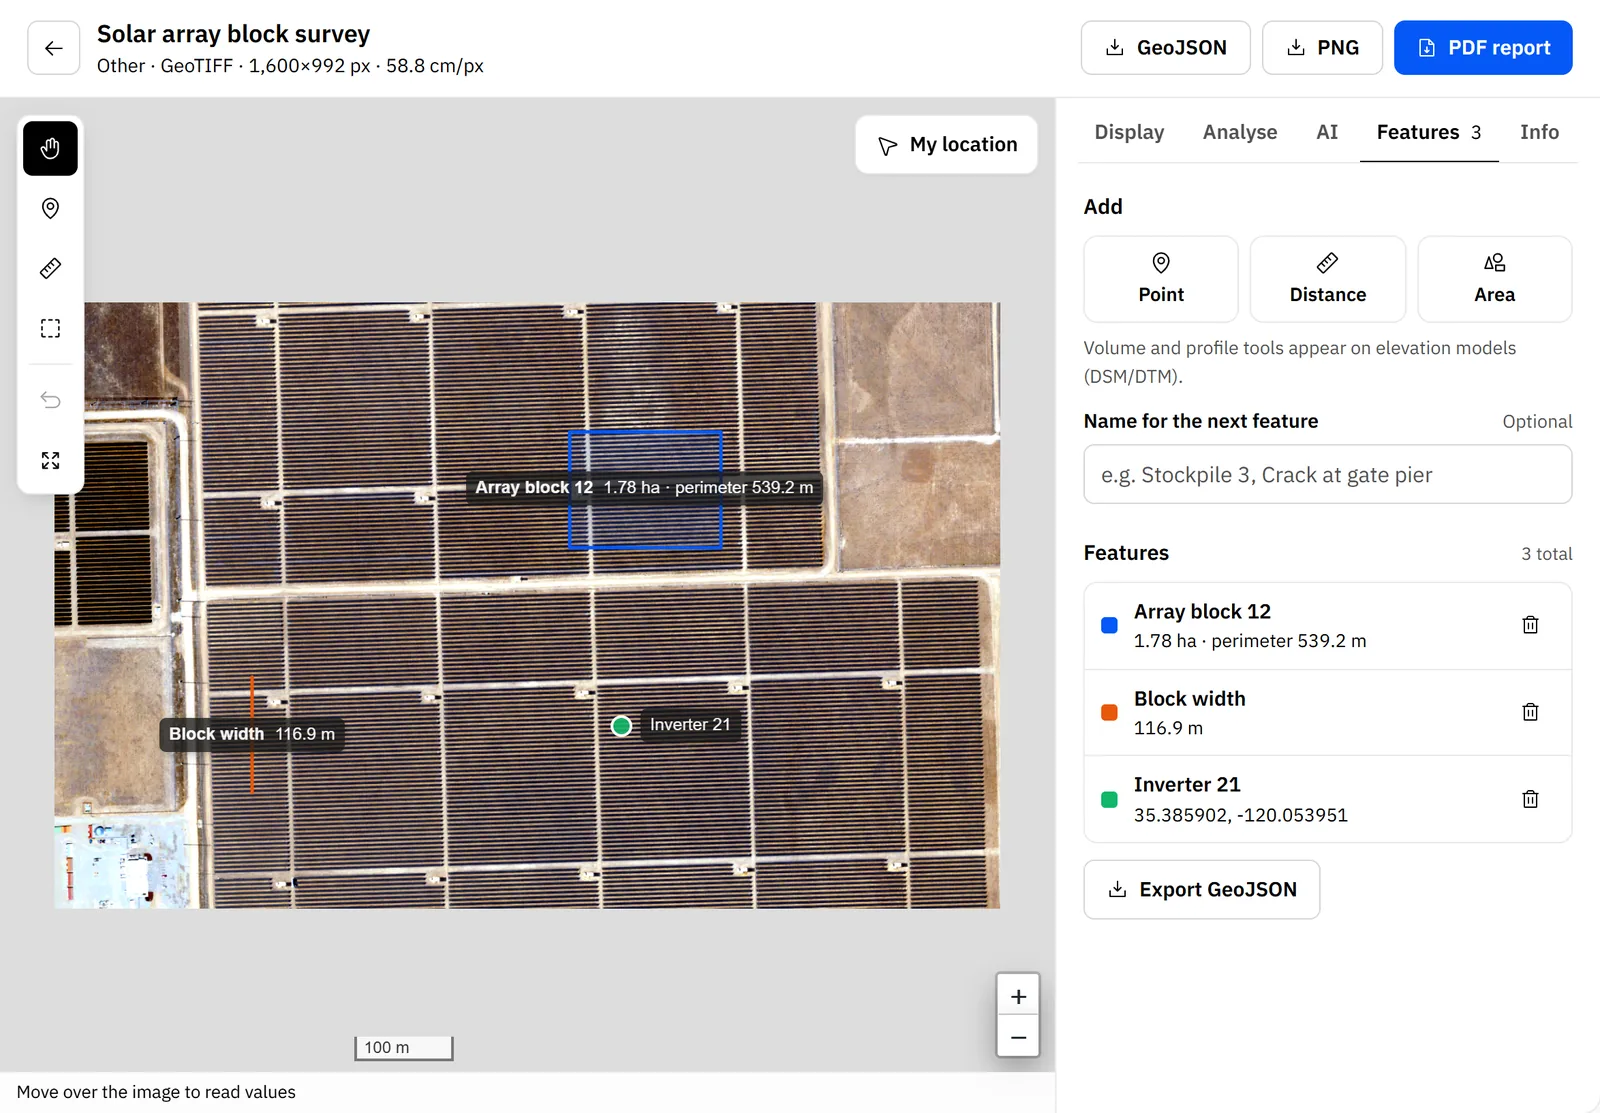
- MeasureAreas, perimeters, lengths and stockpile volumes in metres, drawn straight on the map and pinned with labels.
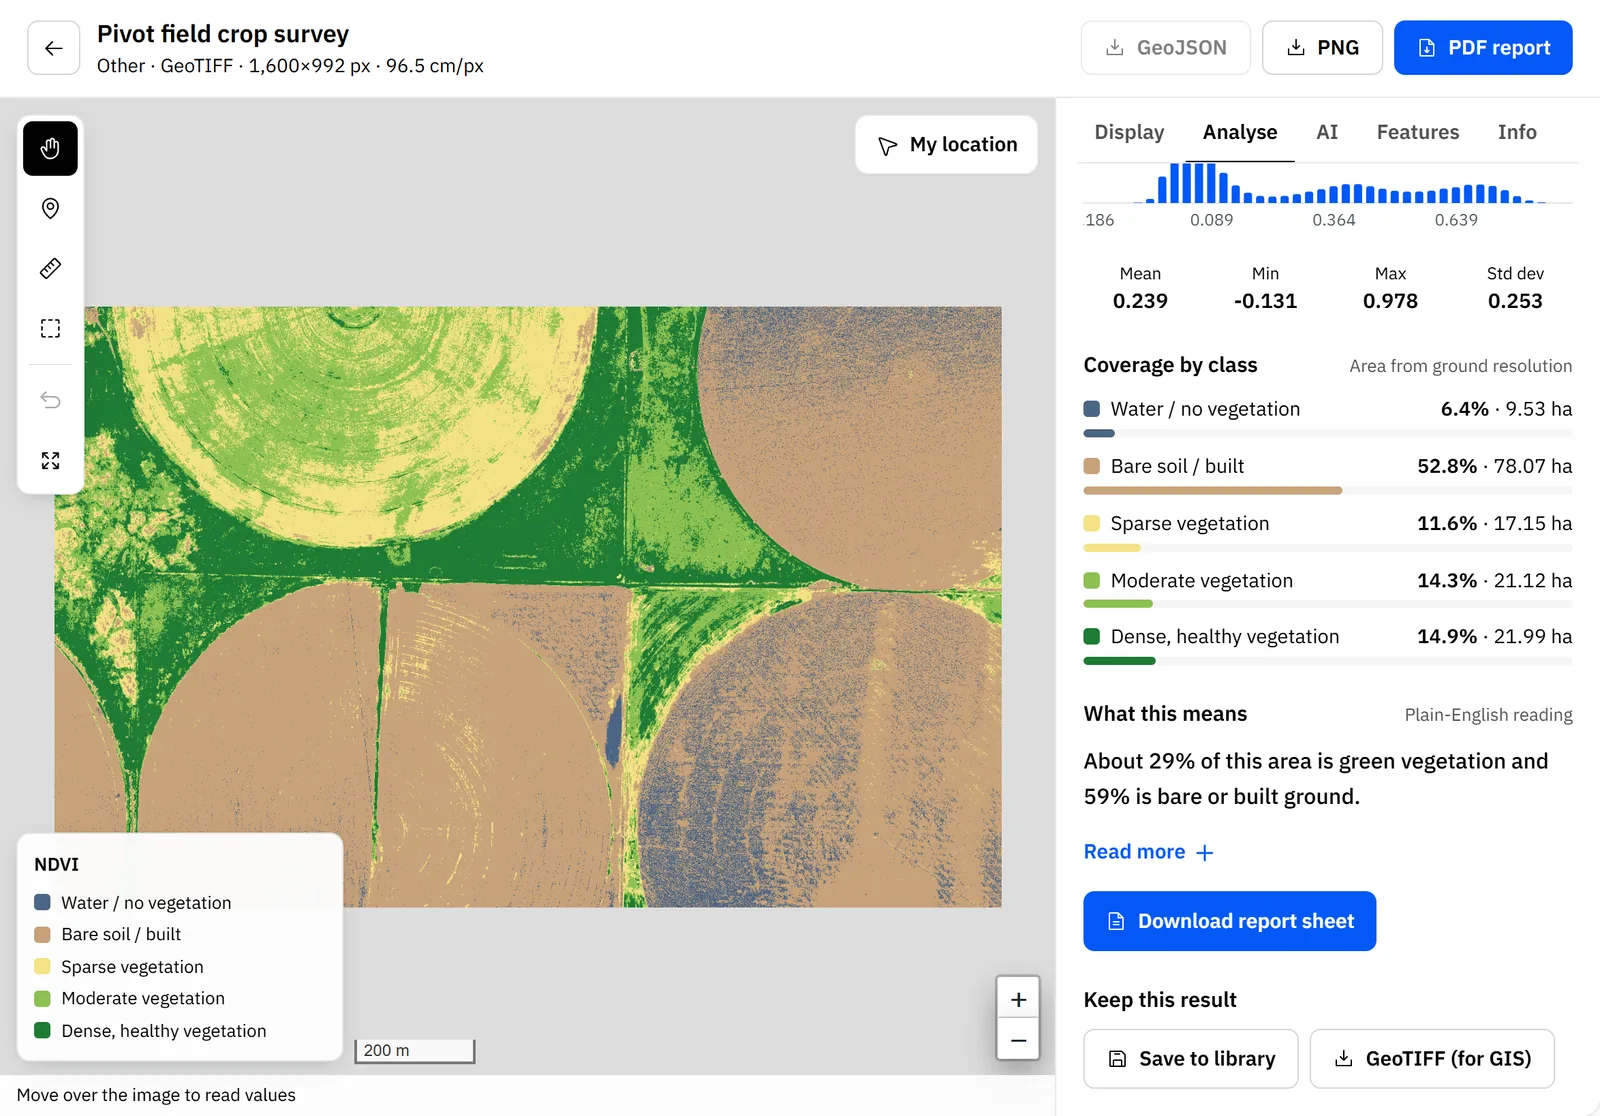
- AnalyseVegetation, water and built-up analysis, elevation profiles and change between flights, for colour, multispectral and thermal imagery.
- ExplainAI site review and plain-English readings that say what the numbers mean and what to do next, in a report you can send.
- ReconcileMonth-end stockpile tonnes and value, checked against your weighbridge, with every difference explained.
Oil & gas
Dronavid · Imagery Lab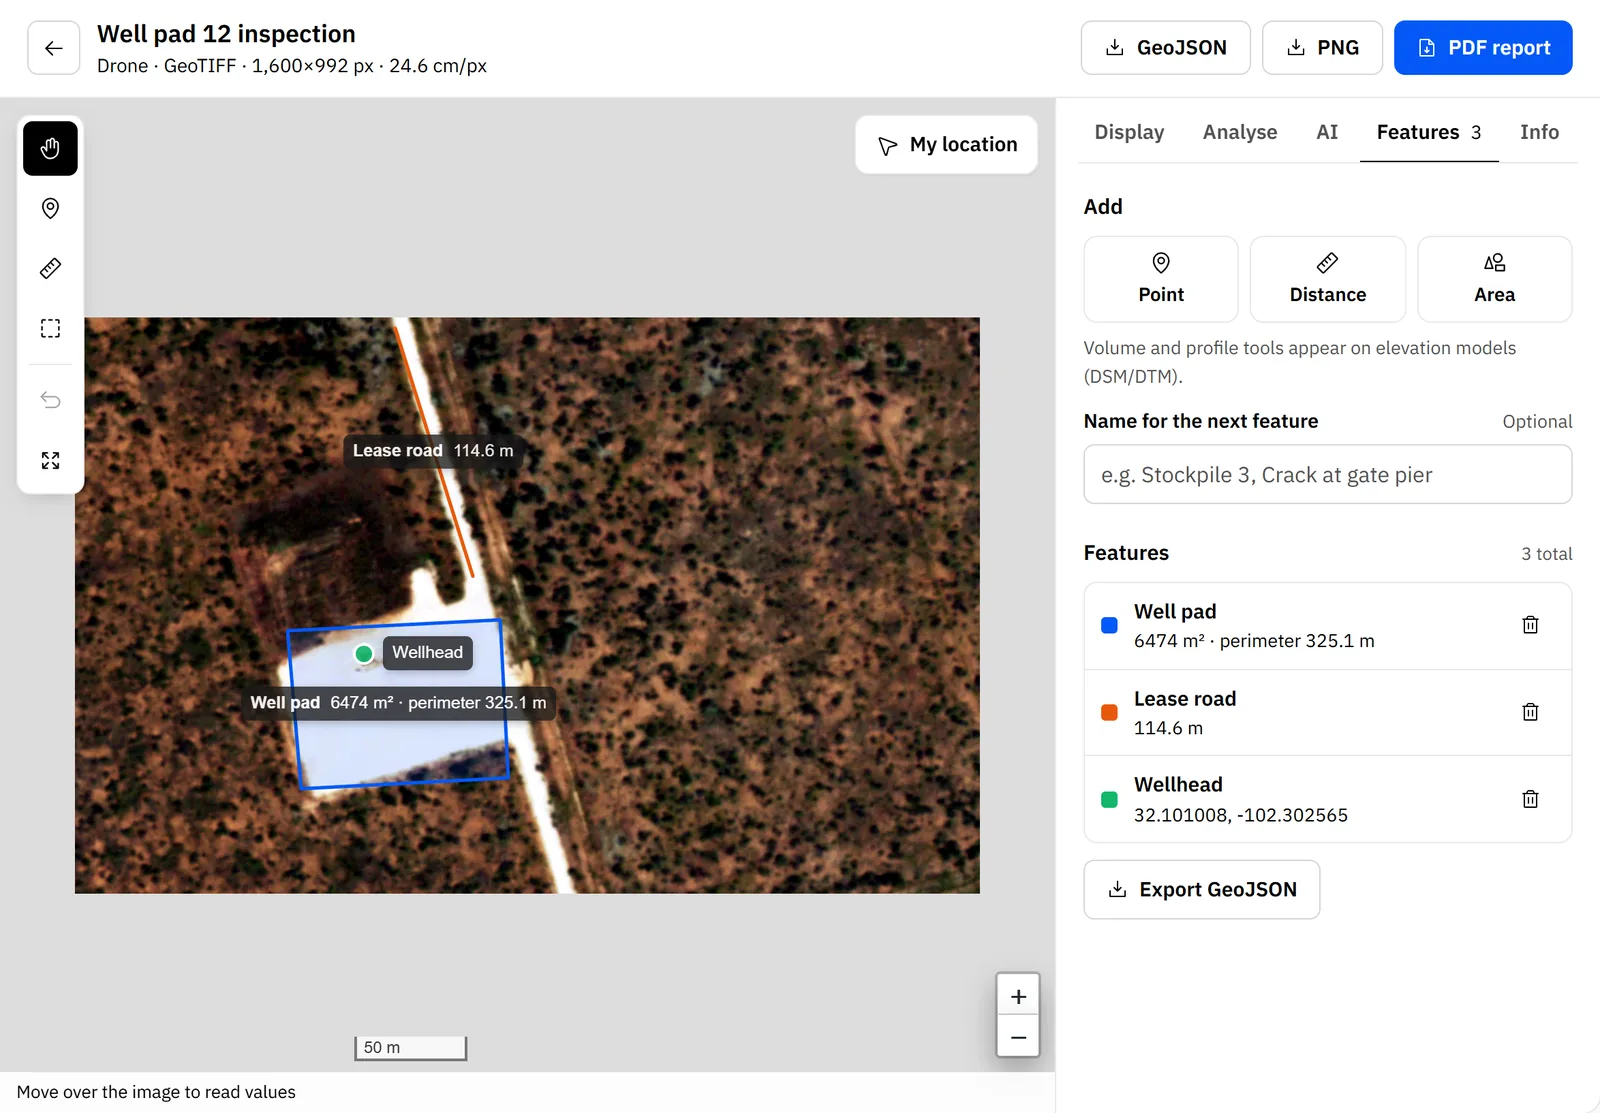
Well pad area and perimeter, lease road length and wellhead position, measured from the imagery. Construction
Dronavid · Imagery Lab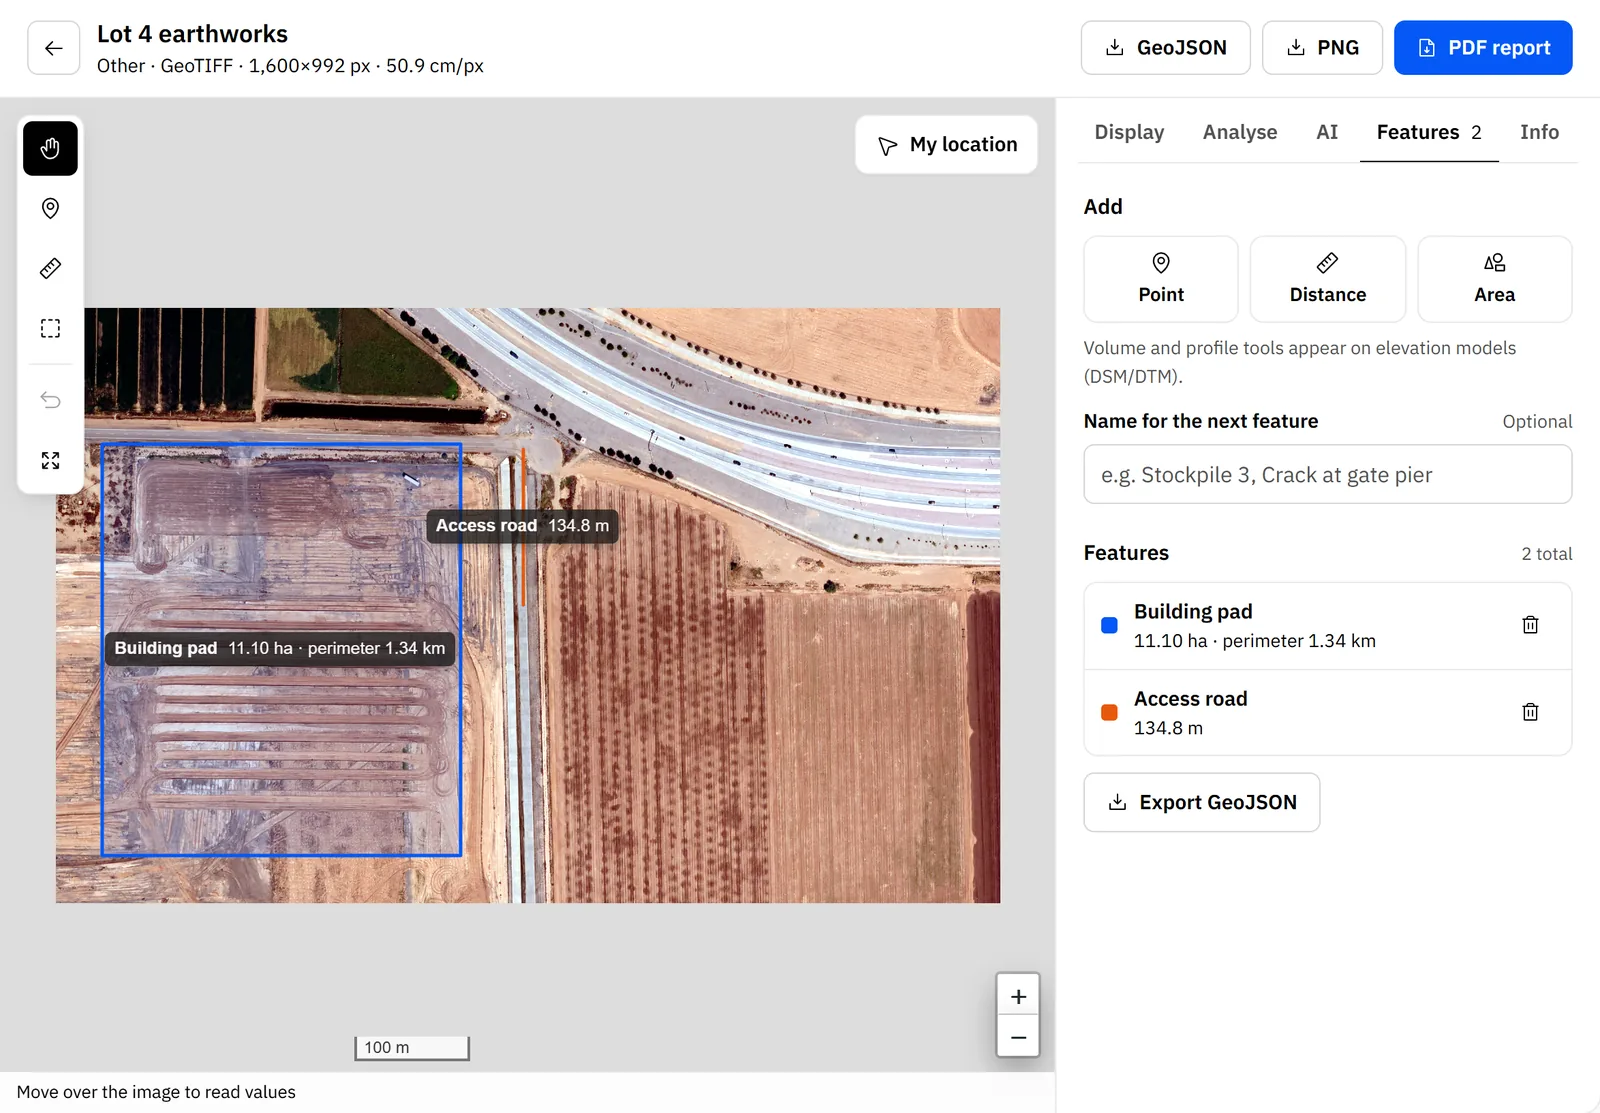
Building pad area and perimeter and access road length, measured from the imagery. Mining & quarrying
Dronavid · Imagery Lab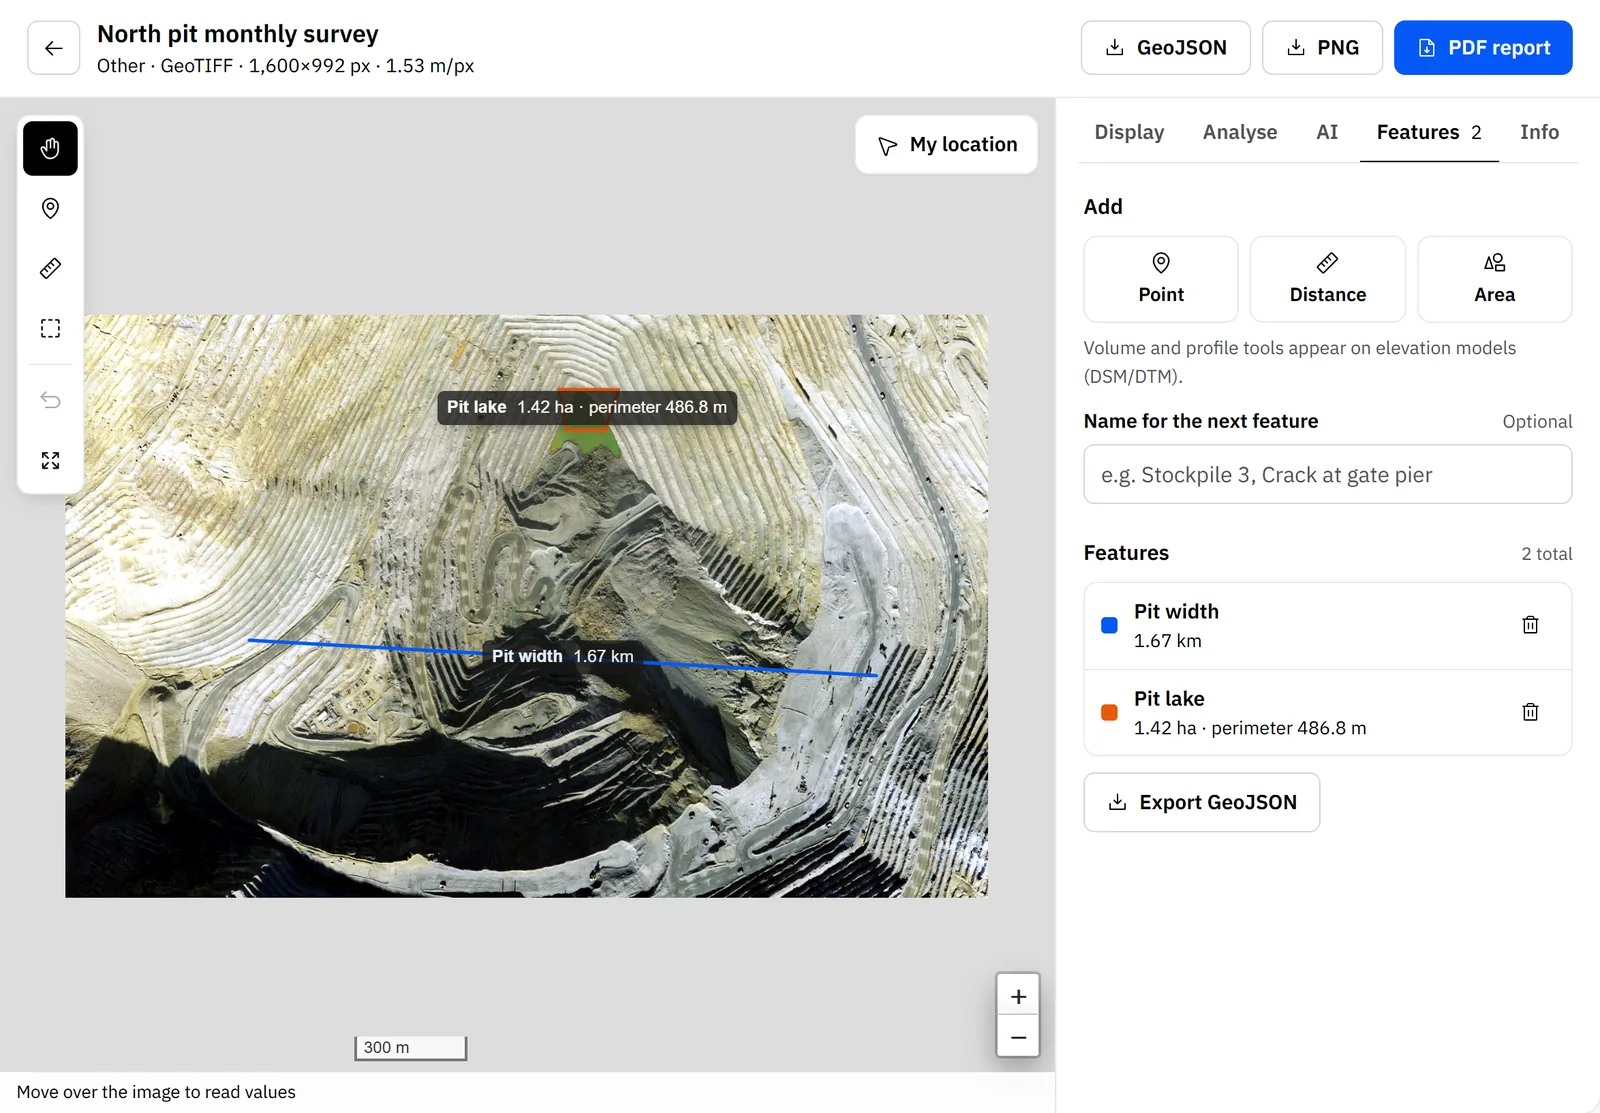
Pit width and pit-lake area, measured from the imagery with labels pinned to the map.
Screenshots of the Dronavid Imagery Lab. Imagery: USDA NAIP, public domain.
Industries
Well pad area and perimeter, lease road length and wellhead position, measured from the imagery.
- Well pads
- Tank batteries
- Pipelines & ROW
- Flare stacks
Well pads, tank batteries and pipeline rights-of-way are spread across remote country, and checking each one by truck takes days.
Dronavid flies visual and thermal inspections on the same path every time, measures pads and containment, and flags encroachment along the right-of-way.
- Sensors
- RGB + Thermal
- Output
- Findings register
- Range (km)
- 40
- Repeat flights
- Same path
- Schedule
- Routine / on-call
- Data
- GIS-ready
Capabilities
RGB + IR
Visual and thermal
Close-range visual and thermal imaging of solar arrays, lines, dams and bridges. Every defect is pinned to a coordinate and compared with the last flight.
Process
Scope
We survey your sites and routes, agree what needs flying and how often, and handle airspace approvals.
Fly
Autonomous missions run on a schedule or on call, monitored live by our operations team from launch to landing.
Process
Imagery uploads as soon as the aircraft is back and is processed into maps, elevation models and measurements.
Report
Findings, defect logs and reports arrive in your dashboard and in the formats your team already uses.
Safety
Every flight is planned, approved and watched. If anything looks wrong, the aircraft comes down safely on its own.
- Redundant navigation, power and communications on every aircraft
- Approved flight corridors and live monitoring of every mission
- Automatic return-to-base or controlled landing on any fault
Questions
What site, asset and survey teams usually ask us first.